Exploratory Data Analysis and General Cleaning
Data Inspection and Cleaning: The China Subset
## Linking to GEOS 3.11.0, GDAL 3.5.3, PROJ 9.1.0; sf_use_s2() is TRUE## ── Attaching core tidyverse packages ───────────────────────────────────────────────── tidyverse 2.0.0 ──
## ✔ dplyr 1.1.4 ✔ stringr 1.5.1
## ✔ forcats 1.0.0 ✔ tibble 3.2.1
## ✔ lubridate 1.9.3 ✔ tidyr 1.3.0
## ✔ purrr 1.0.2## ── Conflicts ─────────────────────────────────────────────────────────────────── tidyverse_conflicts() ──
## ✖ dplyr::filter() masks stats::filter()
## ✖ dplyr::lag() masks stats::lag()
## ✖ purrr::map() masks maps::map()
## ℹ Use the conflicted package (<http://conflicted.r-lib.org/>) to force all conflicts to become errors## Rows: 663 Columns: 85
## ── Column specification ─────────────────────────────────────────────────────────────────────────────────
## Delimiter: ","
## chr (23): Entry_date, Author, Quality_flag, Contributor, Country, Region, Site_name, Site_ID, Manipul...
## dbl (55): Record_number, Study_number, Study_midyear, YearsOfData, Latitude, Longitude, Elevation, Ag...
## lgl (7): Duplicate_record, Rs_spring, Rs_summer, Rs_autumn, Rs_winter, Rootlitter_flux, TotDet_flux
##
## ℹ Use `spec()` to retrieve the full column specification for this data.
## ℹ Specify the column types or set `show_col_types = FALSE` to quiet this message.## Record_number Entry_date Study_number Author Duplicate_record
## Min. : 276 Length:663 Min. : 1426 Length:663 Mode:logical
## 1st Qu.:6322 Class :character 1st Qu.: 7593 Class :character NA's:663
## Median :7540 Mode :character Median : 8576 Mode :character
## Mean :6809 Mean : 8455
## 3rd Qu.:8228 3rd Qu.:10483
## Max. :9548 Max. :11481
##
## Quality_flag Contributor Country Region Site_name
## Length:663 Length:663 Length:663 Length:663 Length:663
## Class :character Class :character Class :character Class :character Class :character
## Mode :character Mode :character Mode :character Mode :character Mode :character
##
##
##
##
## Site_ID Study_midyear YearsOfData Latitude Longitude Elevation
## Length:663 Min. :1997 Min. :0.50 Min. :18.60 Min. : 81.38 Min. : 2.5
## Class :character 1st Qu.:2010 1st Qu.:1.00 1st Qu.:30.52 1st Qu.:101.20 1st Qu.: 600.0
## Mode :character Median :2012 Median :1.00 Median :37.53 Median :112.13 Median :1324.0
## Mean :2010 Mean :1.08 Mean :36.18 Mean :109.14 Mean :1770.0
## 3rd Qu.:2012 3rd Qu.:1.00 3rd Qu.:42.41 3rd Qu.:116.80 3rd Qu.:2476.0
## Max. :2016 Max. :3.00 Max. :51.14 Max. :128.89 Max. :5100.0
## NA's :7 NA's :4 NA's :24 NA's :24 NA's :241
## Manipulation Manipulation_level Age_ecosystem Age_disturbance Species
## Length:663 Length:663 Min. : 1.00 Min. : 0.00 Length:663
## Class :character Class :character 1st Qu.: 11.75 1st Qu.: 3.00 Class :character
## Mode :character Mode :character Median : 21.00 Median : 20.00 Mode :character
## Mean : 33.01 Mean : 28.54
## 3rd Qu.: 50.00 3rd Qu.: 40.00
## Max. :300.00 Max. :400.00
## NA's :587 NA's :518
## Biome Ecosystem_type Ecosystem_state Leaf_habit Stage
## Length:663 Length:663 Length:663 Length:663 Length:663
## Class :character Class :character Class :character Class :character Class :character
## Mode :character Mode :character Mode :character Mode :character Mode :character
##
##
##
##
## Soil_type Soil_drainage Soil_BD Soil_CN Soil_sand Soil_silt
## Length:663 Length:663 Min. :0.520 Min. : 1.85 Min. : 6.00 Min. : 7.00
## Class :character Class :character 1st Qu.:1.130 1st Qu.: 9.35 1st Qu.:31.85 1st Qu.:20.30
## Mode :character Mode :character Median :1.230 Median :12.55 Median :62.75 Median :20.30
## Mean :1.185 Mean :13.42 Mean :48.23 Mean :31.35
## 3rd Qu.:1.310 3rd Qu.:16.17 3rd Qu.:62.75 3rd Qu.:42.00
## Max. :1.700 Max. :66.67 Max. :95.00 Max. :78.00
## NA's :490 NA's :504 NA's :560 NA's :564
## Soil_clay MAT MAP PET Study_temp Study_precip
## Min. : 9.00 Min. :-5.600 Min. : 102.0 Min. : 785 Min. :-3.800 Min. : 238.8
## 1st Qu.:16.95 1st Qu.: 1.800 1st Qu.: 350.9 1st Qu.:1094 1st Qu.: 1.910 1st Qu.: 290.0
## Median :16.95 Median : 6.800 Median : 450.0 Median :1660 Median : 2.380 Median : 382.1
## Mean :22.27 Mean : 7.096 Mean : 664.1 Mean :1564 Mean : 7.013 Mean : 629.0
## 3rd Qu.:25.00 3rd Qu.:12.900 3rd Qu.: 786.3 3rd Qu.:2000 3rd Qu.:16.750 3rd Qu.: 757.0
## Max. :56.30 Max. :25.000 Max. :2198.0 Max. :2400 Max. :21.100 Max. :2198.0
## NA's :539 NA's :47 NA's :49 NA's :531 NA's :614 NA's :597
## Meas_method Collar_height Collar_depth Chamber_area Time_of_day
## Length:663 Min. : 4.40 Min. : 1.500 Min. : 51.25 Length:663
## Class :character 1st Qu.: 5.00 1st Qu.: 2.500 1st Qu.: 86.50 Class :character
## Mode :character Median : 8.00 Median : 3.000 Median : 314.00 Mode :character
## Mean :11.72 Mean : 4.484 Mean : 403.90
## 3rd Qu.:15.00 3rd Qu.: 5.000 3rd Qu.: 323.49
## Max. :50.00 Max. :40.000 Max. :3700.00
## NA's :350 NA's :65 NA's :30
## Meas_interval Annual_coverage Partition_method Rs_annual Rs_annual_err Rs_interann_err
## Min. : 0.10 Min. :0.2000 Length:663 Min. : 79.24 Min. : 10.0 Min. : 11.00
## 1st Qu.: 8.60 1st Qu.:0.3300 Class :character 1st Qu.: 480.93 1st Qu.: 32.9 1st Qu.: 12.50
## Median : 14.00 Median :0.5800 Mode :character Median : 700.00 Median : 67.0 Median : 42.00
## Mean : 19.88 Mean :0.6563 Mean : 721.74 Mean : 81.6 Mean : 89.43
## 3rd Qu.: 30.00 3rd Qu.:1.0000 3rd Qu.: 908.00 3rd Qu.: 96.5 3rd Qu.:148.50
## Max. :120.00 Max. :1.0000 Max. :2062.00 Max. :321.7 Max. :251.00
## NA's :98 NA's :74 NA's :404 NA's :605 NA's :656
## Rlitter_annual Ra_annual Rh_annual RC_annual Rs_spring Rs_summer
## Min. :114.0 Min. : 55.0 Min. : 67.51 Min. :0.200 Mode:logical Mode:logical
## 1st Qu.:167.0 1st Qu.:235.6 1st Qu.: 211.62 1st Qu.:0.330 NA's:663 NA's:663
## Median :236.0 Median :397.0 Median : 292.98 Median :0.385
## Mean :312.3 Mean :370.8 Mean : 424.94 Mean :0.490
## 3rd Qu.:363.0 3rd Qu.:485.0 3rd Qu.: 592.36 3rd Qu.:0.750
## Max. :776.0 Max. :928.0 Max. :1438.00 Max. :0.900
## NA's :656 NA's :630 NA's :615 NA's :625
## Rs_autumn Rs_winter Rs_growingseason Rs_wet Rs_dry RC_seasonal
## Mode:logical Mode:logical Min. :0.1621 Min. :0.800 Min. :0.810 Min. :0.1700
## NA's:663 NA's:663 1st Qu.:1.4565 1st Qu.:1.340 1st Qu.:1.420 1st Qu.:0.3380
## Median :2.0200 Median :1.867 Median :1.900 Median :0.5400
## Mean :2.1780 Mean :2.260 Mean :1.951 Mean :0.4711
## 3rd Qu.:2.8450 3rd Qu.:2.720 3rd Qu.:2.555 3rd Qu.:0.5900
## Max. :7.5100 Max. :5.700 Max. :3.600 Max. :0.7000
## NA's :384 NA's :626 NA's :628 NA's :642
## RC_season GPP ER NEP NPP ANPP
## Length:663 Min. :1511 Min. : 268.7 Min. :-193.0 Min. : 57.52 Min. : 92.84
## Class :character 1st Qu.:1533 1st Qu.: 868.6 1st Qu.: 102.8 1st Qu.: 189.41 1st Qu.:124.10
## Mode :character Median :1555 Median :1054.2 Median : 229.8 Median : 469.00 Median :182.70
## Mean :1555 Mean :1027.2 Mean : 204.6 Mean : 576.98 Mean :199.18
## 3rd Qu.:1577 3rd Qu.:1290.8 3rd Qu.: 287.8 3rd Qu.: 719.20 3rd Qu.:265.27
## Max. :1598 Max. :1706.8 Max. : 675.3 Max. :2279.00 Max. :386.00
## NA's :661 NA's :620 NA's :644 NA's :616 NA's :624
## BNPP NPP_FR TBCA Litter_flux Rootlitter_flux TotDet_flux
## Min. : 50.0 Min. : 77.00 Min. : 388.0 Min. :226.0 Mode:logical Mode:logical
## 1st Qu.: 70.0 1st Qu.: 95.75 1st Qu.: 446.0 1st Qu.:245.0 NA's:663 NA's:663
## Median :125.0 Median :102.00 Median : 504.0 Median :315.0
## Mean :140.4 Mean : 96.75 Mean : 715.3 Mean :336.3
## 3rd Qu.:218.0 3rd Qu.:103.00 3rd Qu.: 879.0 3rd Qu.:428.0
## Max. :245.0 Max. :106.00 Max. :1254.0 Max. :533.0
## NA's :654 NA's :659 NA's :660 NA's :638
## Ndep LAI BA C_veg_total C_AG C_BG
## Min. :0.7 Min. : 1.065 Min. : 3.63 Min. : 81.05 Min. : 22.27 Min. : 7.40
## 1st Qu.:0.7 1st Qu.: 3.325 1st Qu.:28.65 1st Qu.: 96.80 1st Qu.: 54.98 1st Qu.: 42.85
## Median :0.7 Median : 5.600 Median :34.20 Median : 144.15 Median : 129.78 Median : 282.85
## Mean :0.7 Mean : 5.332 Mean :52.31 Mean : 3929.33 Mean : 3470.84 Mean : 1355.74
## 3rd Qu.:0.7 3rd Qu.: 6.375 3rd Qu.:91.00 3rd Qu.: 675.90 3rd Qu.: 1075.67 3rd Qu.: 1343.75
## Max. :0.7 Max. :11.500 Max. :91.00 Max. :34150.00 Max. :26800.00 Max. :10910.05
## NA's :660 NA's :637 NA's :603 NA's :635 NA's :623 NA's :609
## C_CR C_FR C_litter C_soilmineral C_soildepth
## Min. : 0.00 Min. : 35.99 Min. : 0.62 Min. : 3950 Min. : 10.00
## 1st Qu.: 0.00 1st Qu.: 42.85 1st Qu.: 173.00 1st Qu.: 5322 1st Qu.: 10.00
## Median : 42.48 Median : 84.36 Median : 253.00 Median : 5720 Median : 20.00
## Mean : 314.08 Mean :119.75 Mean : 552.97 Mean : 8693 Mean : 30.11
## 3rd Qu.: 208.66 3rd Qu.:159.57 3rd Qu.: 350.00 3rd Qu.: 8502 3rd Qu.: 45.00
## Max. :2040.00 Max. :365.00 Max. :4700.00 Max. :26860 Max. :100.00
## NA's :635 NA's :625 NA's :642 NA's :639 NA's :619
## Notes
## Length:663
## Class :character
## Mode :character
##
##
##
## Great, we see the length of this set is 663, and we have a very large amount of NULL values which is one of the main obstacles with this dataset.
How many NULL Values?
##      Record_number         Entry_date       Study_number             Author   Duplicate_record
##                  0                  0                  0                  0                663
##       Quality_flag        Contributor            Country             Region          Site_name
##                  0                  0                  0                 88                102
##            Site_ID      Study_midyear        YearsOfData           Latitude          Longitude
##                  0                  7                  4                 24                 24
##          Elevation       Manipulation Manipulation_level      Age_ecosystem    Age_disturbance
##                241                  0                329                587                518
##            Species              Biome     Ecosystem_type    Ecosystem_state         Leaf_habit
##                 22                 37                  0                 10                 30
##              Stage          Soil_type      Soil_drainage            Soil_BD            Soil_CN
##                 25                202                 59                490                504
##          Soil_sand          Soil_silt          Soil_clay                MAT                MAP
##                560                564                539                 47                 49
##                PET         Study_temp       Study_precip        Meas_method      Collar_height
##                531                614                597                  3                350
##       Collar_depth       Chamber_area        Time_of_day      Meas_interval    Annual_coverage
##                 65                 30                316                 98                 74
##   Partition_method          Rs_annual      Rs_annual_err    Rs_interann_err     Rlitter_annual
##                550                404                605                656                656
##          Ra_annual          Rh_annual          RC_annual          Rs_spring          Rs_summer
##                630                615                625                663                663
##          Rs_autumn          Rs_winter   Rs_growingseason             Rs_wet             Rs_dry
##                663                663                384                626                628
##        RC_seasonal          RC_season                GPP                 ER                NEP
##                642                650                661                620                644
##                NPP               ANPP               BNPP             NPP_FR               TBCA
##                616                624                654                659                660
##        Litter_flux    Rootlitter_flux        TotDet_flux               Ndep                LAI
##                638                663                663                660                637
##                 BA        C_veg_total               C_AG               C_BG               C_CR
##                603                635                623                609                635
##               C_FR           C_litter      C_soilmineral        C_soildepth              Notes
##                625                642                639                619                300
Great, now lets drop all the rows that don’t contain information about the annual Soil Respiration (the column Rs_annual), and drop the empty columns because those will render useless to us.
#drop rows with no annual rs, and no geographical location (I normally wouldnt worry too much, but it's a geography course, and we might want to view these points on a map):

#drop empties
china <- china %>% drop_na(Rs_annual)
china <-  china %>% drop_na(Longitude)
china <- china %>% drop_na(Latitude)

#proportion empty
na_props <- colMeans(is.na(china))

#select all that are not 100% empty
full_columns <- na_props != 1

#keep only those columns
cleaned_china <- china[, full_columns]
Okay that seems much better, let’s take a look at the distribution of soil respiration:
Distribution of Annual Soil Respiration:
hist(cleaned_china$Rs_annual, main = "Distribution of Anual Soil Respiration: China 1995 - 2015", xlab = "Annual Respiration (g Cm^(-2))", col="darkgreen")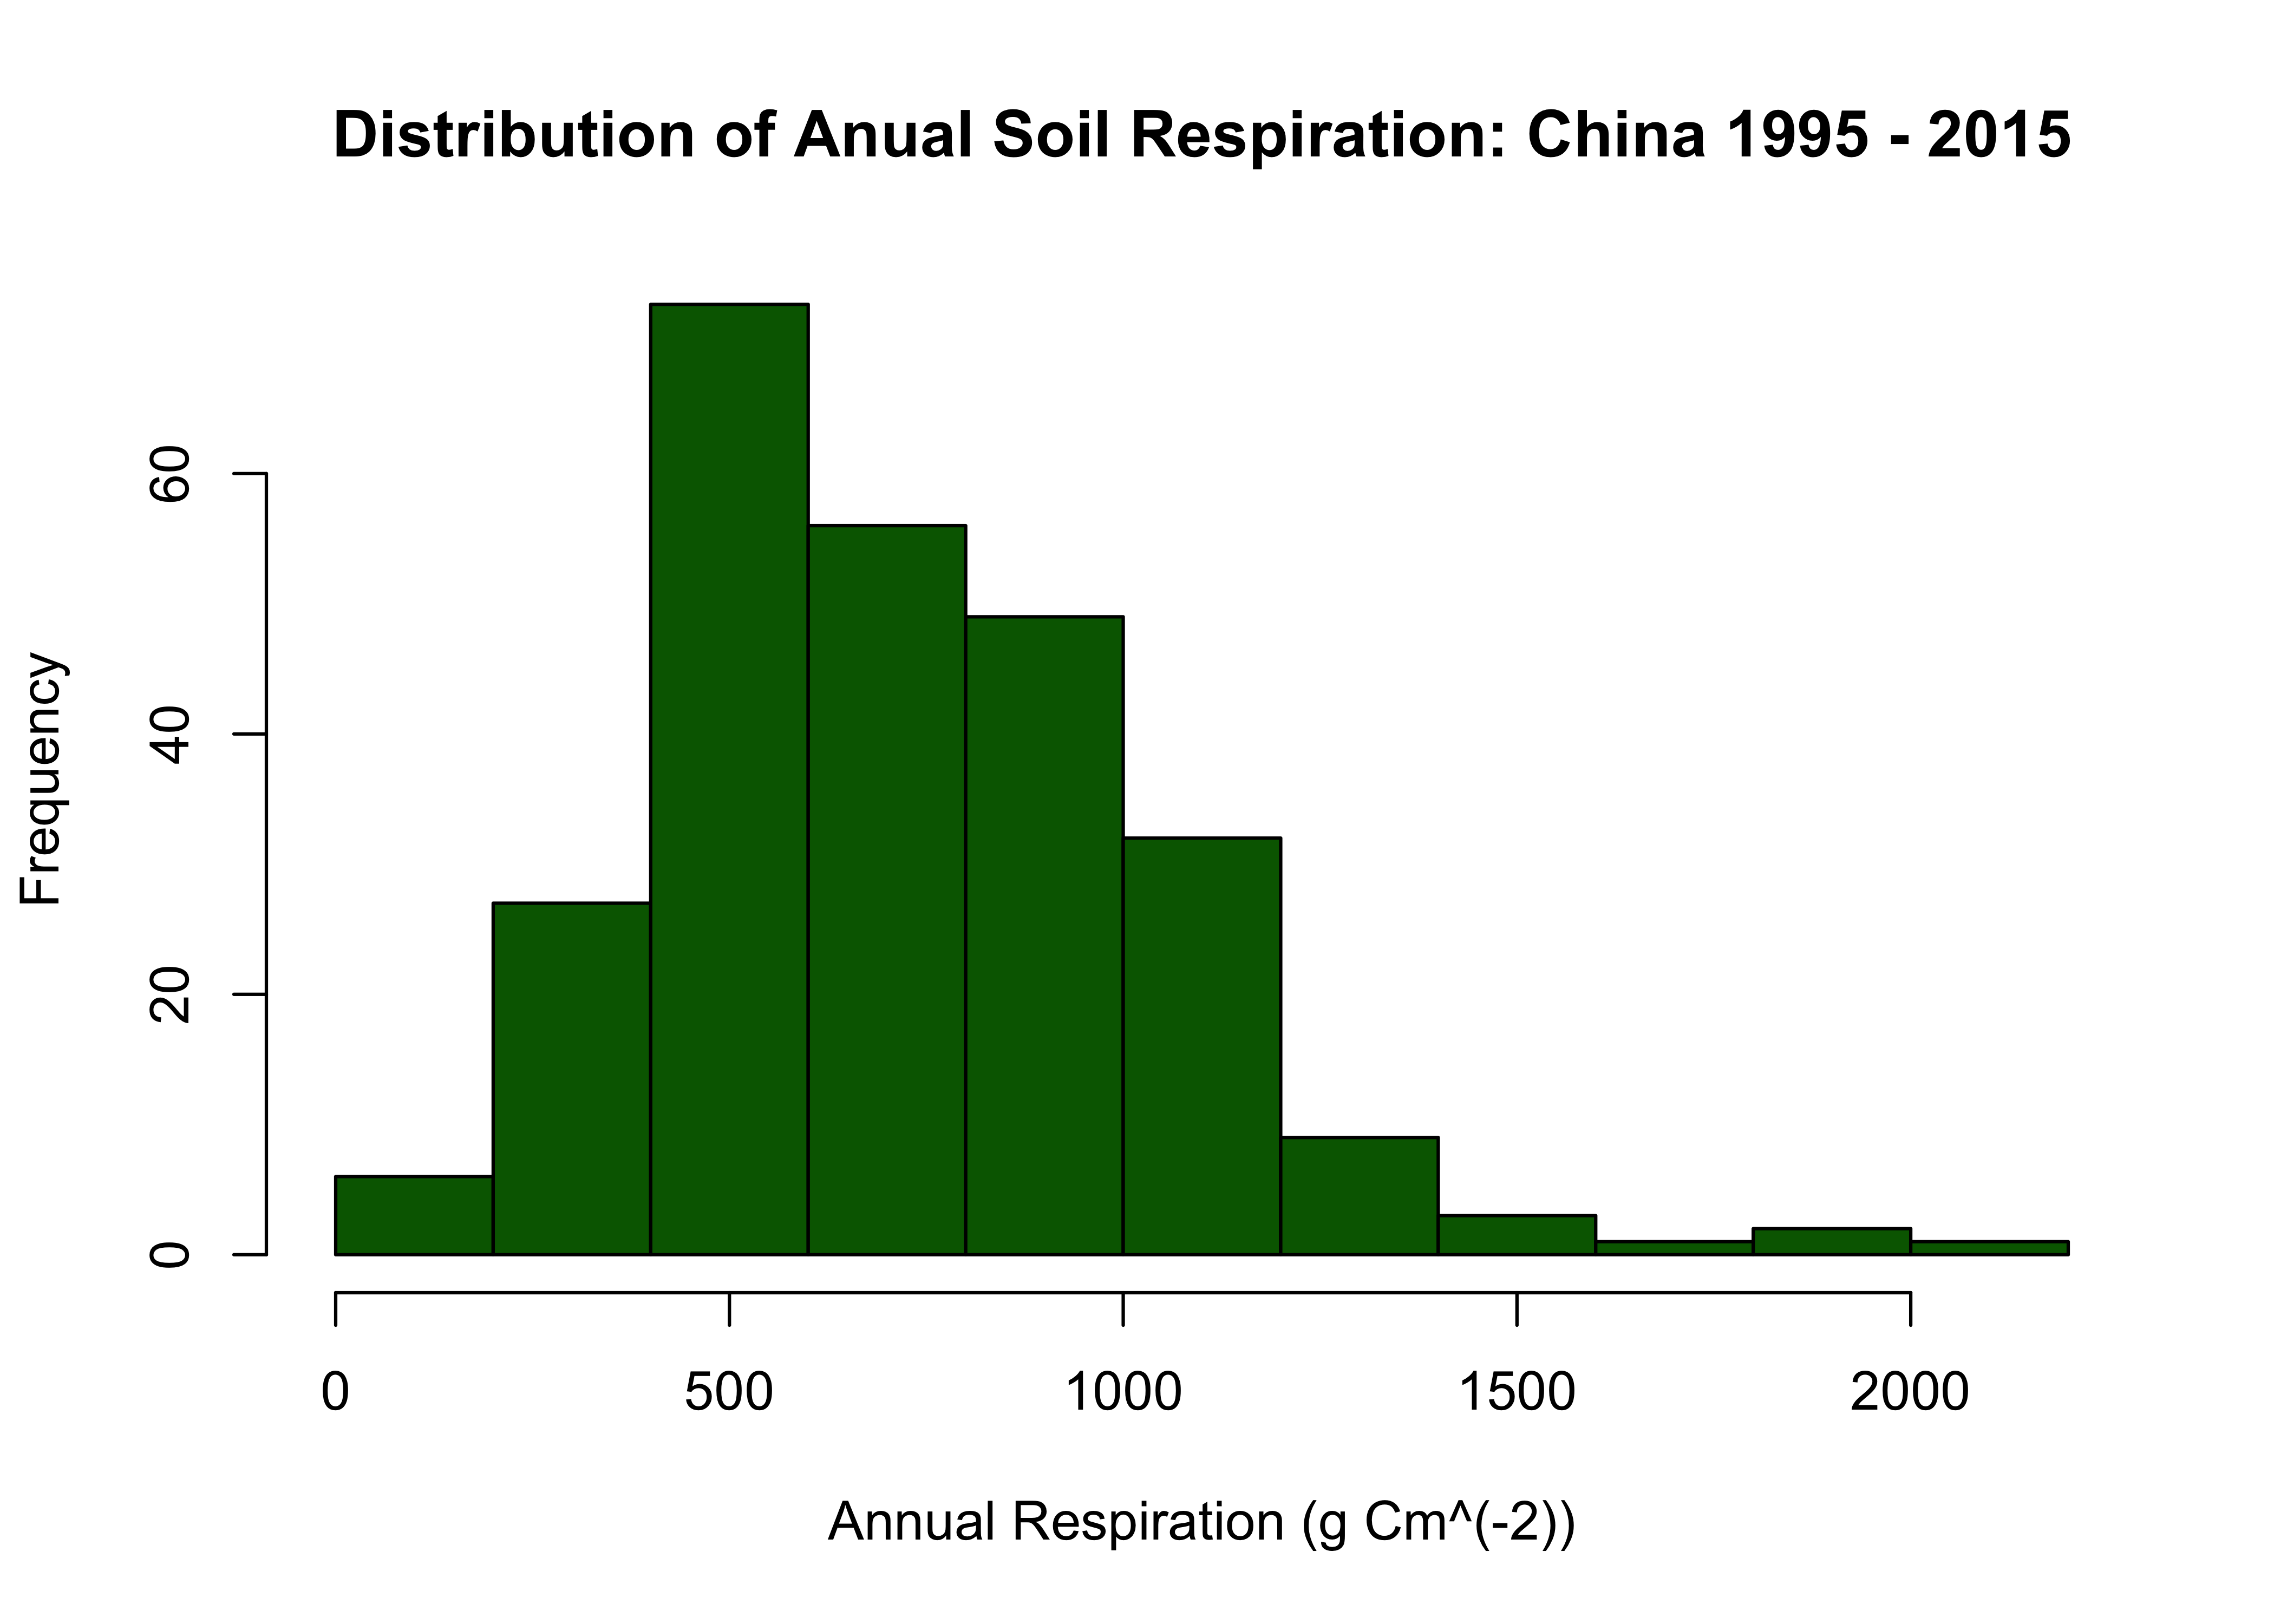
And similarly to our last section I want to see the geographical distribution of this new cleaned data subset.
Graphing the new cleaned data set:
#Make a base map
china_map = map_data("worldHires", region = "china")
#added noise to the points x and y values
#color by Rs_annual
ggplot() +
geom_polygon(data = china_map, aes(x = long, y = lat, group = group), fill = "lightblue", color='black') +
geom_point(data = cleaned_china, aes(x = Longitude+rnorm(n=nrow(cleaned_china)), y = Latitude+rnorm(n=nrow(cleaned_china)), color=Rs_annual)) +
coord_map(projection = "mercator") +
labs(title = "Map of Soil Sample Sites in China", x = "Longitude", y = "Latitude")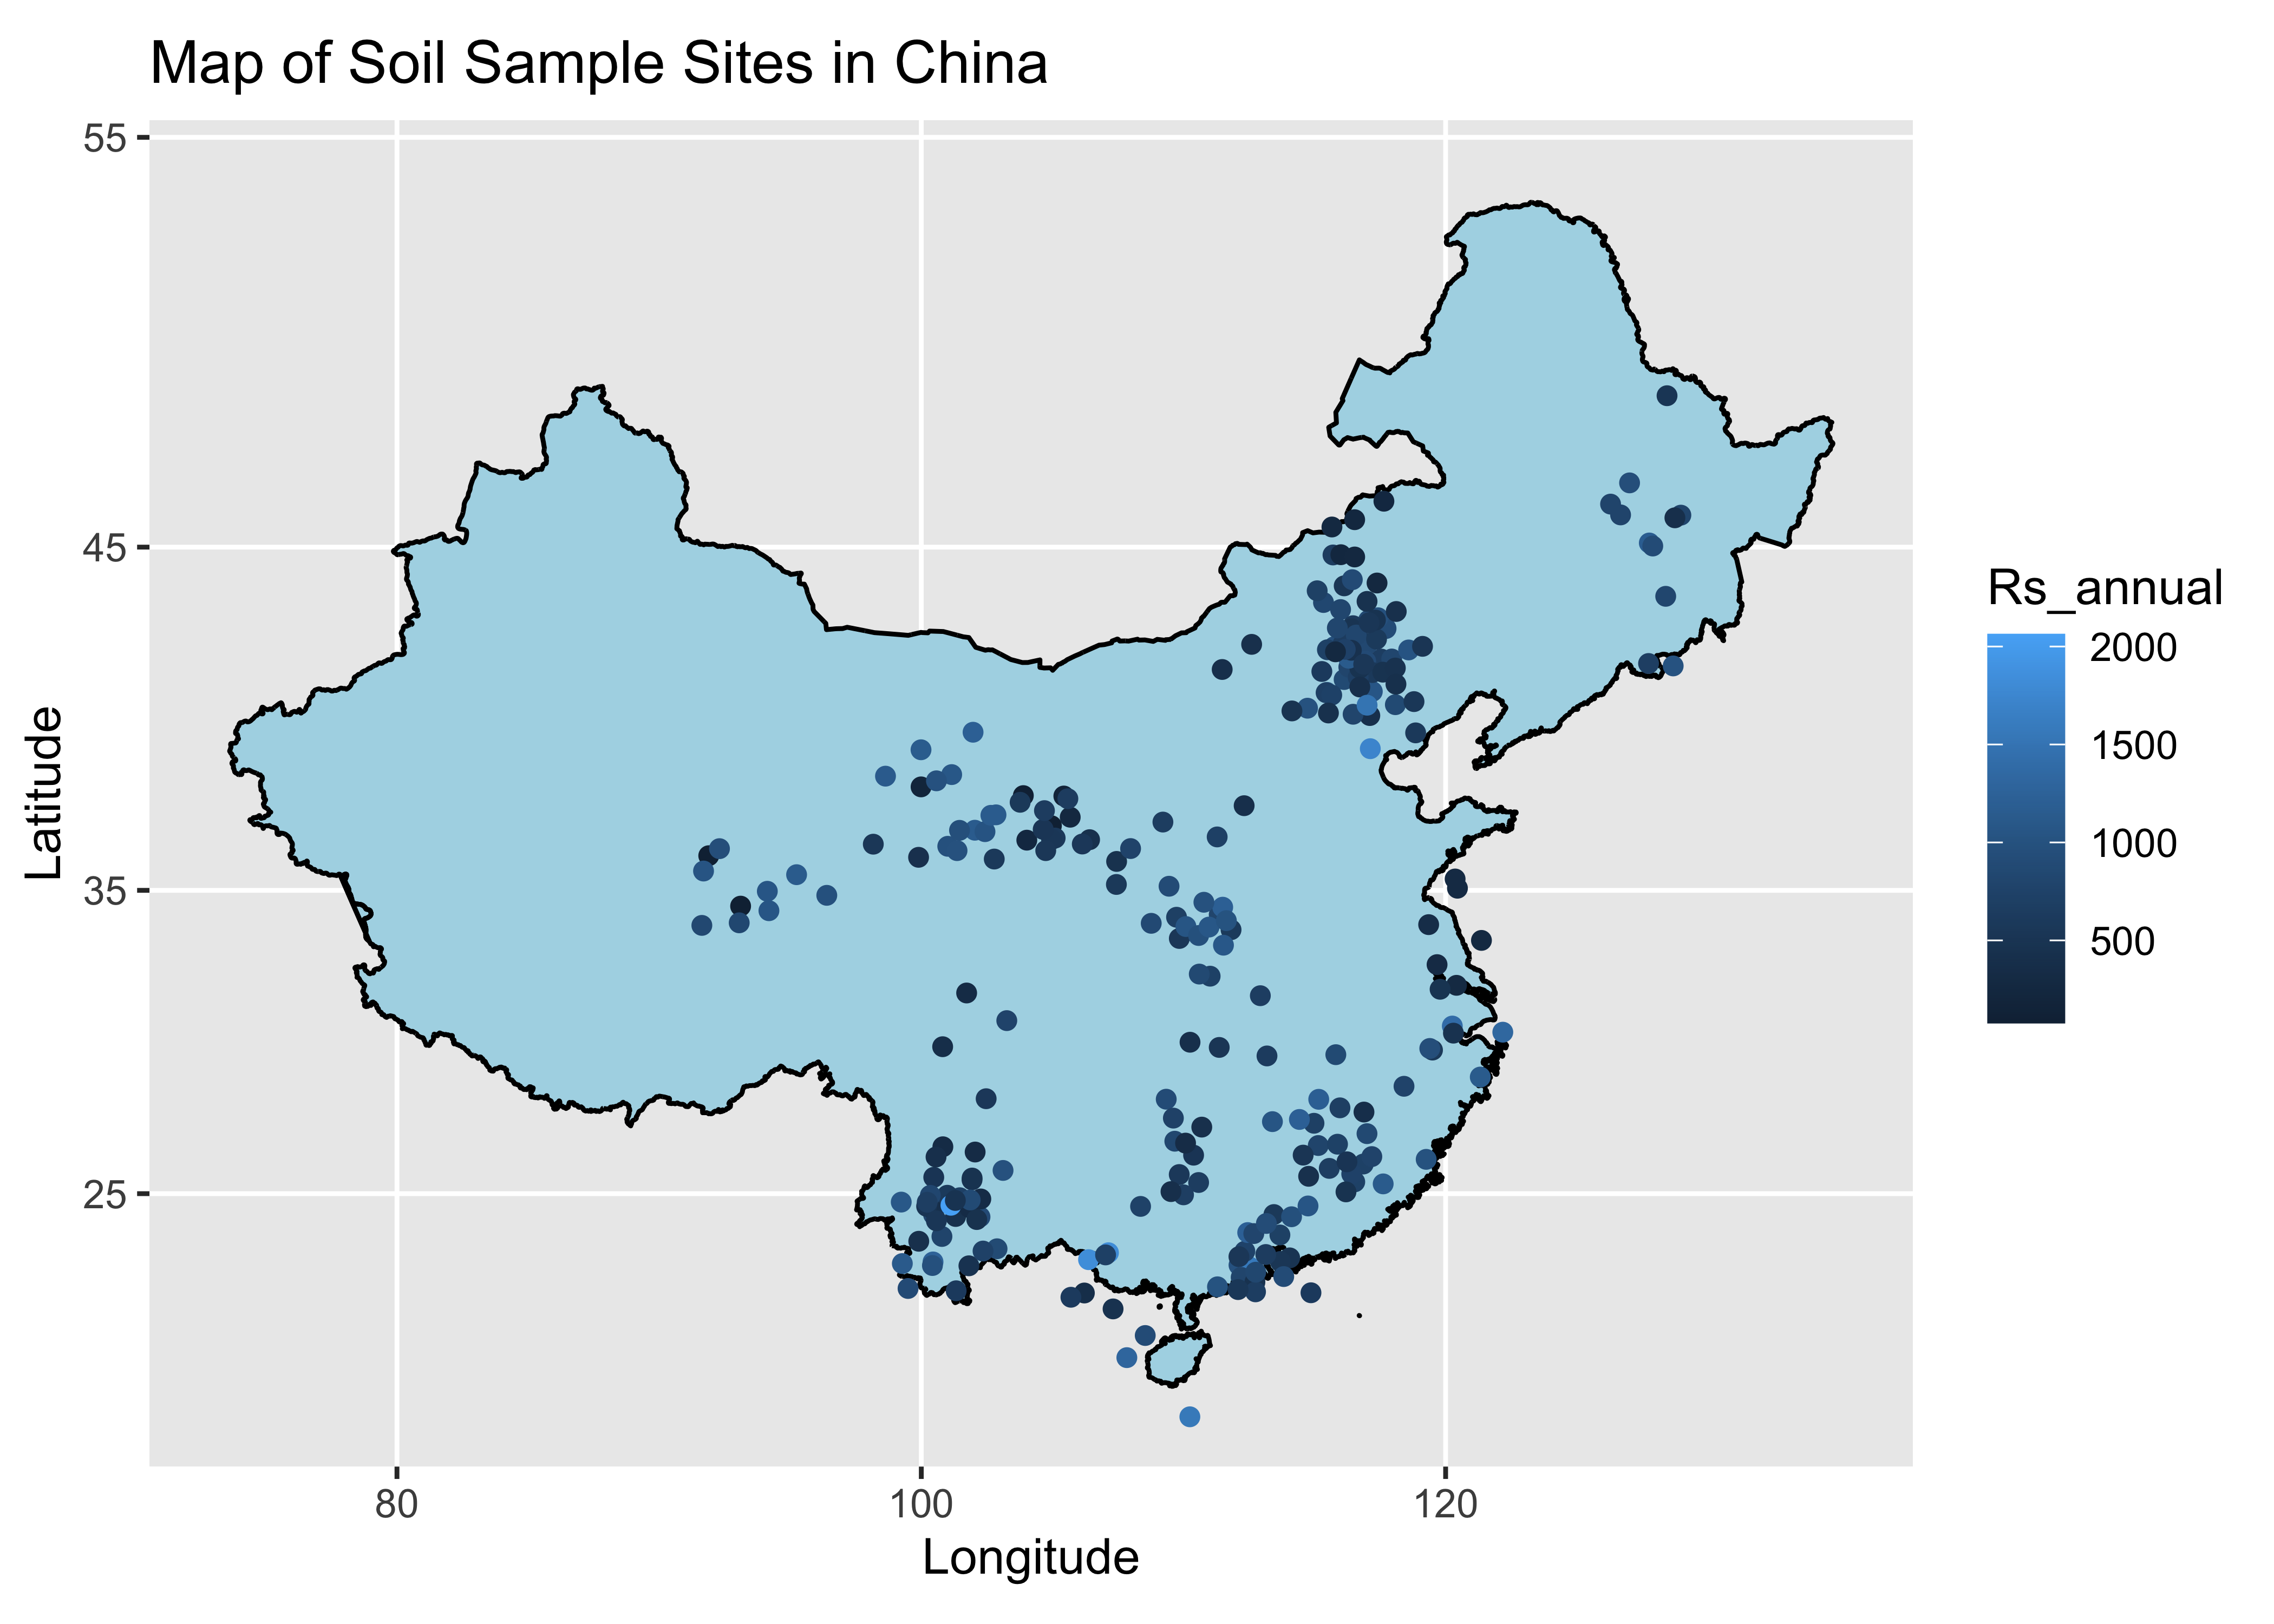 Great, we can see here that there is a pretty wide range of values of
annual respiration. I am now going to ask the question, what is the
average difference between the maximum and minimum annual soil
respiration values in China?
Great, we can see here that there is a pretty wide range of values of
annual respiration. I am now going to ask the question, what is the
average difference between the maximum and minimum annual soil
respiration values in China?
Thinking About the Average Difference of Minimum and Maximum Annual Soil Respiration:
First let’s calculate the median for each year (mostly to increase understanding in the data):
Rs_median <- cleaned_china %>% group_by(Study_midyear) %>% summarize(Median = median(Rs_annual), High = max(Rs_annual), Min = min(Rs_annual))
Rs_median
## # A tibble: 30 × 4
## Study_midyear Median High Min
## <dbl> <dbl> <dbl> <dbl>
## 1 2000. 581 775 385
## 2 2000 80.0 80.0 80.0
## 3 2001 79.2 79.2 79.2
## 4 2003 1017 1240 425
## 5 2004. 1001 1586 578
## 6 2004 743 992 440
## 7 2004. 786. 1173 403
## 8 2005 450. 720 191
## 9 2006. 824. 851 662
## 10 2006 530 822 322
## # ℹ 20 more rowsmmm <- ggplot(Rs_median, aes(x = Study_midyear)) +
geom_line(aes(y = Median, color = "Median")) +
geom_line(aes(y = High, color = "Maximum")) +
geom_line(aes(y = Min, color = "Minimum")) +
labs(x = "Study Year", y = "Annual Soil Respiration (g Cm^(-2))", title = "Median, Maximum, and Minimum Soil Respiration in China") +
scale_color_manual(values = c("Median" = "darkblue", "Maximum" = "darkred", "Minimum" = "darkgreen")) +
theme_minimal()
mmm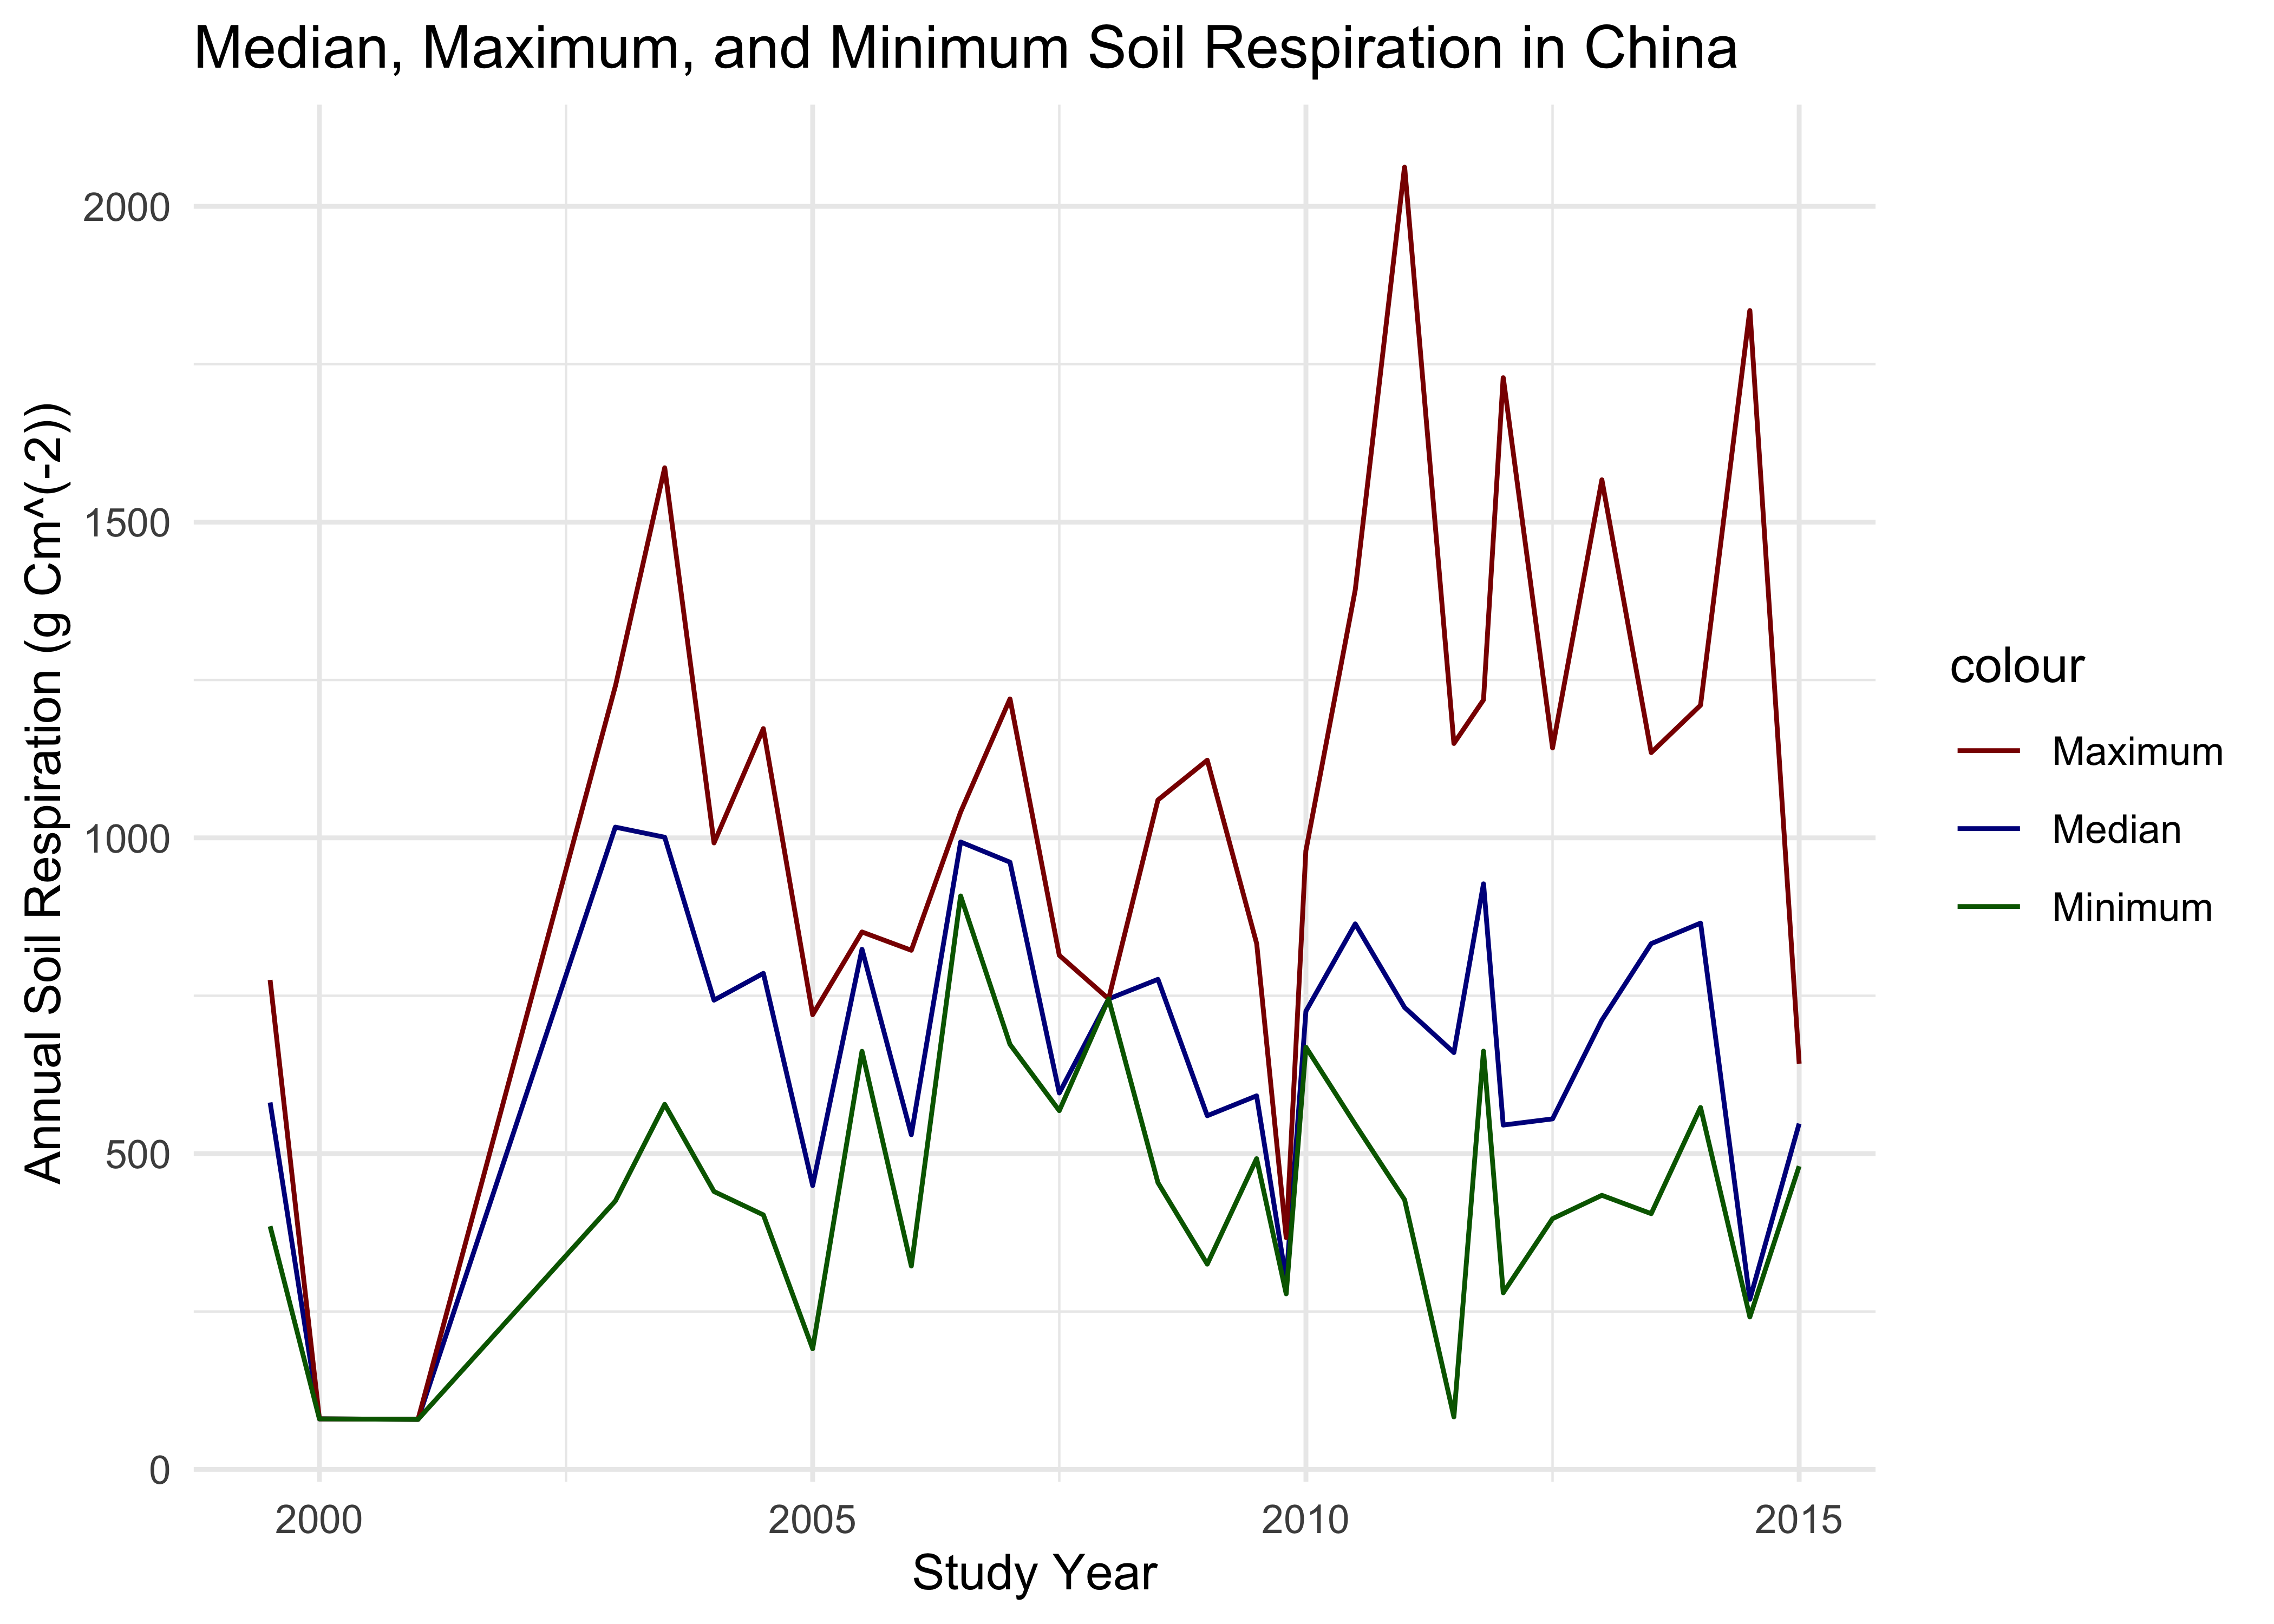
We see here the temporal changes from 1999 to 2015, and we see how the soil respiration really fluctuates from year to year with an interesting pattern, it looks like the gap between the min and max values really increase as time goes on (with the exception of 2015 especially, which again may be due to lack of data). What is very interesting to me are the gaps between the min and max values for each year. This is what we will investigate in the next section, by sampling the small subset we are left with and calculating a distribution of total mean differences between the max and min values.